How we made the scenarios
The scenarios are fictional: they were built in an internal exercise, with AI agents cast in the roles of civil servants, then selected and editorially reviewed by ARSC. The values come from the Brașov model, version 0.2.0, snapshot of 2 August 2026. Some are taken from sources, others calculated in the platform, estimated or assumed as hypotheses, and each one carries its own label.
The model is built from the city's public documents: the mobility plan, local strategies, official statistics, European Earth observation layers and open mapping. These five situations were selected because they show how the work is done, including when the platform says it does not have the data.
What the labels next to the figures mean
The full method and the provenance records are available to partner institutions.
An opinion on a zonal urban plan, in a neighbourhood with a high degree of soil sealing
Fictional role: adviser, Urban Planning Department. Deadline: before the technical committee.
The documentation for a zonal urban plan (PUZ) for a mixed-use residential development, on a plot in the Astra neighbourhood, enters the department's internal workflow. The developer requests the preliminary approval to initiate the plan (aviz de oportunitate), and the chief architect's instruction asks for an opinion on the climate and public space aspects. The adviser knows from experience that Astra is a neighbourhood of apartment blocks with little landscaped green space, but an opinion that says so without a comparable value behind it can be quickly challenged in committee.
To decide: which climate compensation conditions can be required in the preliminary approval, backed by a value that is comparable across neighbourhoods.
The data used
- City Twin calculation on Copernicus dataImpervious surface in the Astra neighbourhood: 59.4%. The mean of the Copernicus HRL Imperviousness Density 2021, at 10 metre resolution, clipped to the neighbourhood polygon. The neighbourhood value results from a spatial calculation; the source does not publish it as such.
- City Twin calculationPosition in the ranking of the 15 neighbourhoods: Astra is third, after the historic centre (73.7%) and Florilor-Craiter (60.5%). The median of the values calculated for the 15 neighbourhoods is 37.9%.
- Direct sourceThe municipality's climate context: summer 2025, absolute maximum 34.8 °C, 4 days with a maximum of at least 32 °C, no tropical nights; summer 2026, period covered 1 June - 24 July, absolute maximum 32.1 °C, one heatwave day, one tropical night. Sources: Open-Meteo, ERA5 reanalysis.
- EstimateGreen cover in Astra: 9%, from a preliminary assessment on open map data. A low-confidence estimate, declared as such; it is not the complement of the impervious surface percentage.
- Missing informationNeighbourhood-level population for Astra. The model has population data for only four areas of the city.
- Direct sourceSurface temperature in Astra, from a single satellite pass (Landsat 8/9, 29 June 2026, around midday): 45.8 °C, 5.3 °C above the city average. It is not the perceived air temperature and it is not a summer average.
The steps in the platform
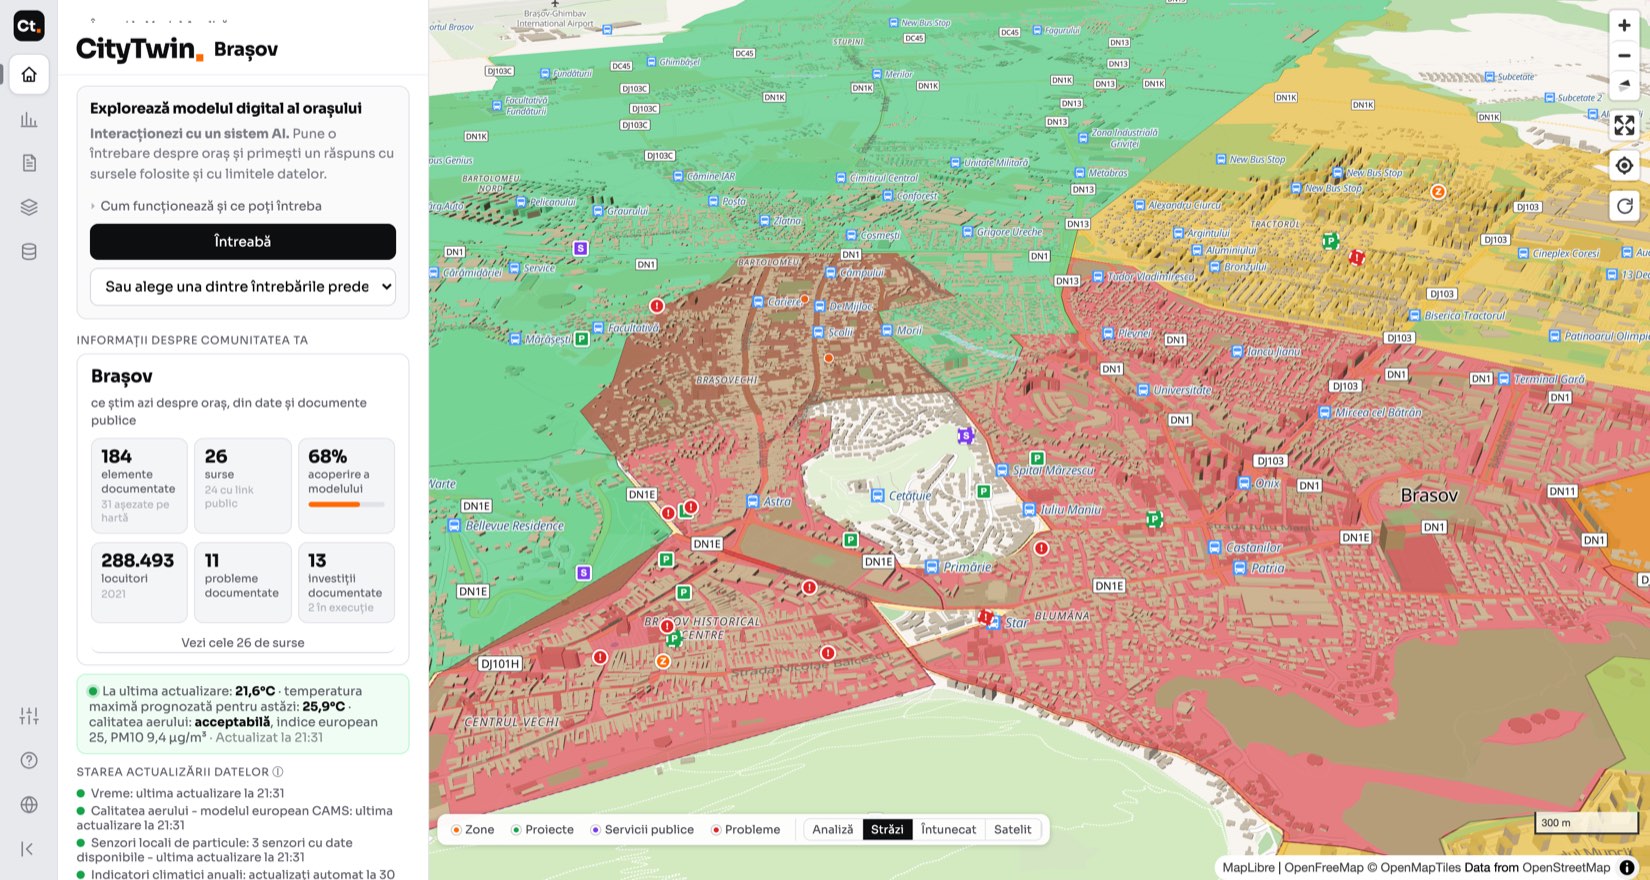
- 1Opened the climate view and read the neighbourhood record, with the method shown next to the value: source, resolution, reference year.
- 2Asked for the ranking of the 15 neighbourhoods, not a single value. A single value is not enough in committee; a position in the ranking can be defended.
- 3Checked, in the problem coverage view, whether the area has documented problems in the integrated sources. For Astra, none, which is reported as information missing from the model, not as proof that the area has no problems.
- 4Tested a green space and a cooling point inside the perimeter in the simulator, saved the scenario with a name and an objective, and exported the report for the file.
The resulting document
"The site is located in the Astra neighbourhood, where impervious surface accounts for 59.4% of the neighbourhood's area. The value is calculated uniformly for all neighbourhoods from the Copernicus imperviousness density layer, at 10 metre resolution, reference year 2021."
"For Brașov there is satellite-estimated surface temperature, by neighbourhood; in Astra, 45.8 °C in the pass of 29 June 2026. There is no air temperature measured at a station in each neighbourhood, so the value does not describe perceived thermal comfort."
"It is proposed to approve the initiation of the plan, on condition that the landscaped green space is provided at ground level, on natural soil, not on a slab over a basement. The minimum percentage remains to be set: it is an option proposed by the specialist in the exercise, to be checked against the local urban planning regulation and the applicable legislation."
- Backed by dataThe 59.4% impervious surface in Astra and the 45.8 °C surface temperature, each with its source, resolution and date shown next to the value.
- Calculated by the platformThird place out of 15 and the 37.9% median of the values calculated for the neighbourhoods.
- MissingIn Astra there is no documented climate problem in the integrated sources; the documented problem is located in the Old Town. The platform said so, even though the adviser was looking for the opposite confirmation.
- Human decisionThe approval conditions, that is green space at ground level, the balance of permeable surfaces and the planting plan, were drafted by the adviser.
See the full case
The question and the answer
The ranking of the 15 neighbourhoods by impervious surface. Astra is third, with 59.4%, after the historic centre (73.7%) and Florilor-Craiter (60.5%). The median of the values calculated for the 15 neighbourhoods is 37.9%.
The climate problem documented in the integrated sources is "heat islands, a centre with a high degree of soil sealing and little greenery", and it is located in the Old Town. There is no recorded climate problem in Astra.
Sources cited: the local strategy, Copernicus, Open-MeteoSummer 2025: absolute maximum 34.8 °C, 4 days with a maximum of at least 32 °C, no tropical nights. Summer 2026: absolute maximum 32.1 °C, one heatwave day, one tropical night.
Note: the 2026 season is still under way, with the period covered being 1 June - 24 July. Its values cannot be compared with a completed year.
Sources cited: Open-Meteo, ERA5 reanalysisWho did what
Other observations
In the simulation, when the adviser asked how many residents a green space inside the perimeter would serve, the platform did not show a value of zero without explanation: it said the site falls outside the neighbourhoods for which the model has population data. The plan's perimeter could not be drawn on the map, only approximated with two points, which is below the level of precision of urban planning documentation.
The other four situations, in brief
The exercise covered five situations in a city hall. The one above is published in full, to show the way of working. For the other four, the result remains here; the steps, the data used and the documents prepared are worked through together with the partner institution.
- TransportReply to a petition for a new bus stop: the walking access area before and after, with the number of residents within it, plus the existing stops less than ten minutes' walk away.
- MonitoringThe annual report on the mobility plan targets, when the baseline values are from 2015: which targets can be measured with the existing data and which remain unmeasurable, stated explicitly.
- City leadershipThe order of investments for next year: each item with a value behind it, and the items without data declared as such, not filled in with estimates.
- ProcurementChecking the quantities in the technical specifications before the tender documentation is published: where the figures in the documentation depart from the geometry in the model, and by how much.
The four full records, with the data used and the resulting documents, are available to partner institutions.
Try the demonstration
The public demonstration shows a selection from the platform, without an account: the map of Brașov, an analysis of heat vulnerability with its sources and limits, and a simulation of a cooling point. The situation above is worked on in the version for partner institutions. The figures here come from model version 0.2.0, snapshot of 2 August 2026, so some may have changed since.
The exercise is repeated periodically, with other roles and other situations. This page will be updated as the model is completed and new situations are added.